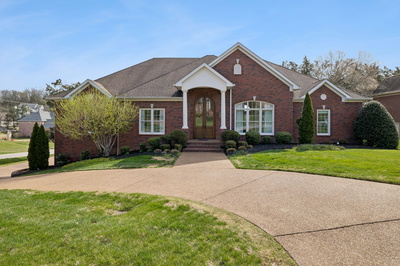
MLS# 3146632
55
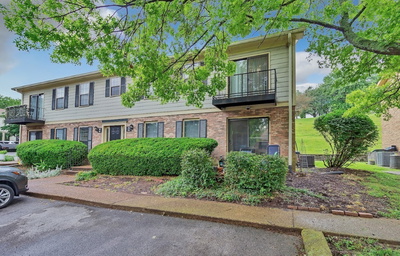
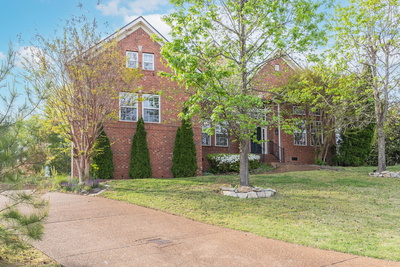
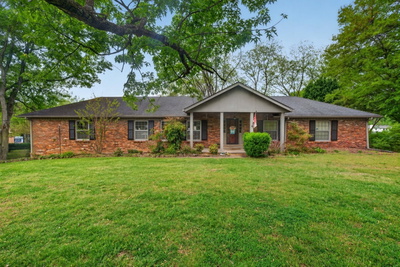
$515,000
$277/sqft
3 beds
2 baths
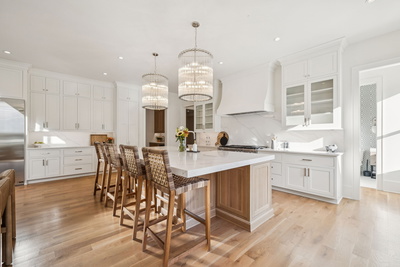
1,857 sqft
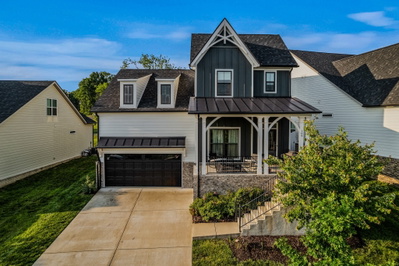
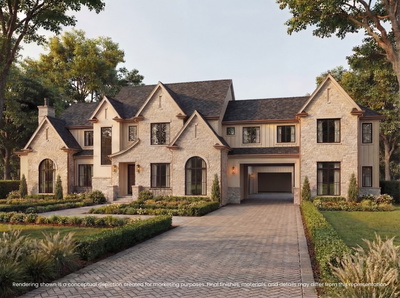
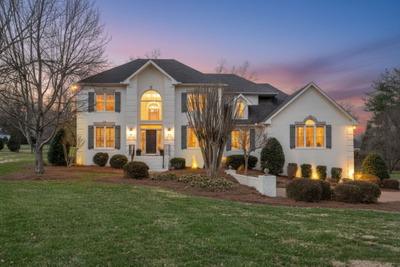
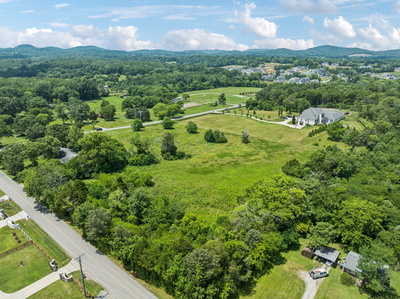
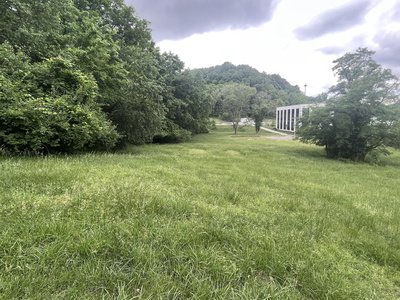
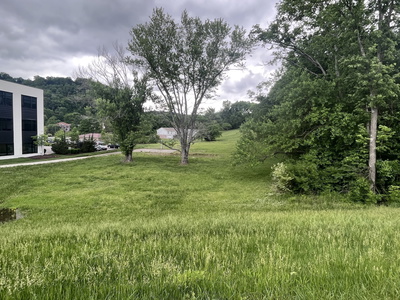
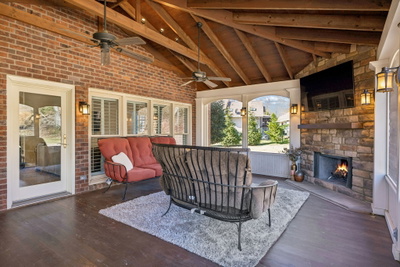
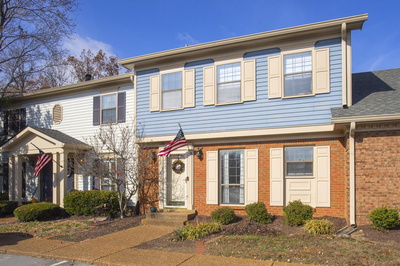
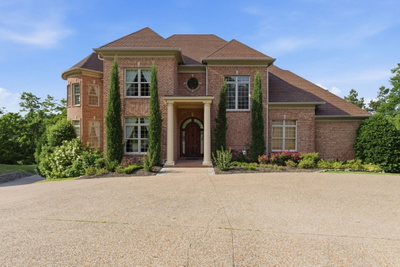
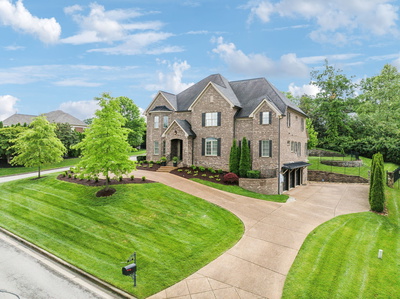
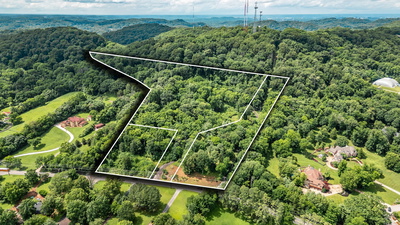
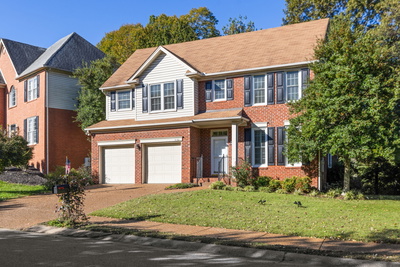
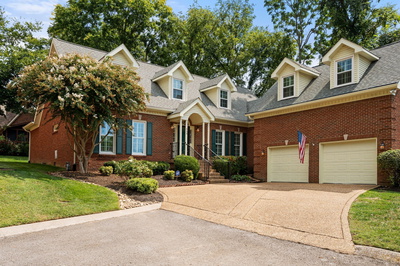
508 Brentwood Pt, Brentwood, TN
Built 1984
93 days on market